Abstract:The trend trading strategy is a common and effective approach in the forex market, and it involves the use of four common indicators—Moving Average, Moving Average Convergence Divergence (MACD), Relative Strength Index (RSI), and On-Balance Volume (OBV). These indicators offer rich market information and trading signals. Traders need to use these indicators judiciously, considering risk management, to continually enhance their analytical skills and market insight, leading to better trading outcomes.
In the modern financial markets, foreign exchange trading has always been a focus due to its high liquidity and global nature. In order to survive in this market full of opportunities and challenges, investors have devised countless trading strategies. Some of these strategies have withstood the test of the market and are still in use today, while others may have been gradually phased out due to their inability to adapt to the market. Among them, trend trading strategy has become one of the most commonly used strategies. This article will take you into the world of trend trading strategy by thoroughly analyzing the four most commonly used indicators in trend trading.
In foreign exchange trading, technical analysis indicators can help traders better understand market trends and make decisions. Before we begin, we first need to understand the categories into which technical analysis indicators can be divided.

We categorize them into four types of indicators:
Trend Indicators:
Definition: Trend indicators help traders identify the direction of the market, whether it is in an upward trend, a downward trend, or a sideways trend.
Common trend indicators: Moving averages (such as simple moving averages and exponential moving averages), trendlines, trend channels, etc.
Application: Traders can use trend indicators to confirm market trends in order to formulate more targeted trading strategies.
Momentum Indicators:
Definition: Momentum indicators measure the speed and magnitude of price changes, typically used to assess market strength or weakness and identify overbought or oversold conditions.
Common momentum indicators: Relative Strength Index (RSI), Stochastic Oscillator, Momentum Index, etc.
Application: Traders can use momentum indicators to determine market strength or weakness and potential reversal signals.
Volume Indicators:
Definition: Volume indicators measure the quantity of trades in the market, reflecting the strength of buying and selling activities. High volume may imply the continuity of a trend.
Common volume indicators: Volume bars, Accumulation/Distribution Line, Relative Volume Index, etc.
Application: Volume indicators can be used to confirm trends, assess the reliability of trends, and identify potential reversal signals.
Volatility Indicators:
Definition: Volatility indicators measure the extent of market price fluctuations, helping to understand market instability.
Common volatility indicators: Average True Range (ATR), Volatility Index (VIX), etc.
Application: Volatility indicators can be used to set stop-loss levels, identify potential market risks, and adjust trading strategies to adapt to market conditions.
Forex Trend Trading is a strategy for foreign exchange trading that involves analyzing the direction and strength of trends in the market. The core idea of this strategy is based on the belief that market prices will exhibit a certain directionality, namely a trend. Implementing this strategy primarily involves two categories of indicators—trend indicators and momentum indicators: first, using trend indicators to determine the direction of asset price fluctuations; then, employing momentum indicators to assess the strength of the trend. After clarifying these fundamental concepts, let's explore the four commonly used indicators in this strategy.
Moving Average(MA)
Definition
A Moving Average (MA) is a statistical tool used to smooth time-series data. It calculates the average value of data over a specific time period and plots a curve based on this average. This helps reduce the random fluctuations in prices or other variables, making trends and cycles more apparent. However, it's important to note that moving averages cannot predict future stock prices; they merely reveal the average trend of prices over a certain period.
Classification
In moving averages, the length of the time period is adjustable, allowing analysts or traders to choose shorter periods (short-term moving averages) or longer periods (long-term moving averages) based on their needs and strategies. Common types of moving averages include Simple Moving Average (SMA) and Exponential Moving Average (EMA).
Simple Moving Average (SMA): Calculates the average value of all data points over a specific time period. For example, a 5-day SMA considers the closing prices of the last 5 days, calculates their average, and plots that average as a point on the chart. The process is repeated for each subsequent trading day.
Exponential Moving Average (EMA): Places more emphasis on recent price data by using a weighted average, giving greater influence to the latest prices. This allows the EMA to respond more quickly to the latest market changes.
Usage
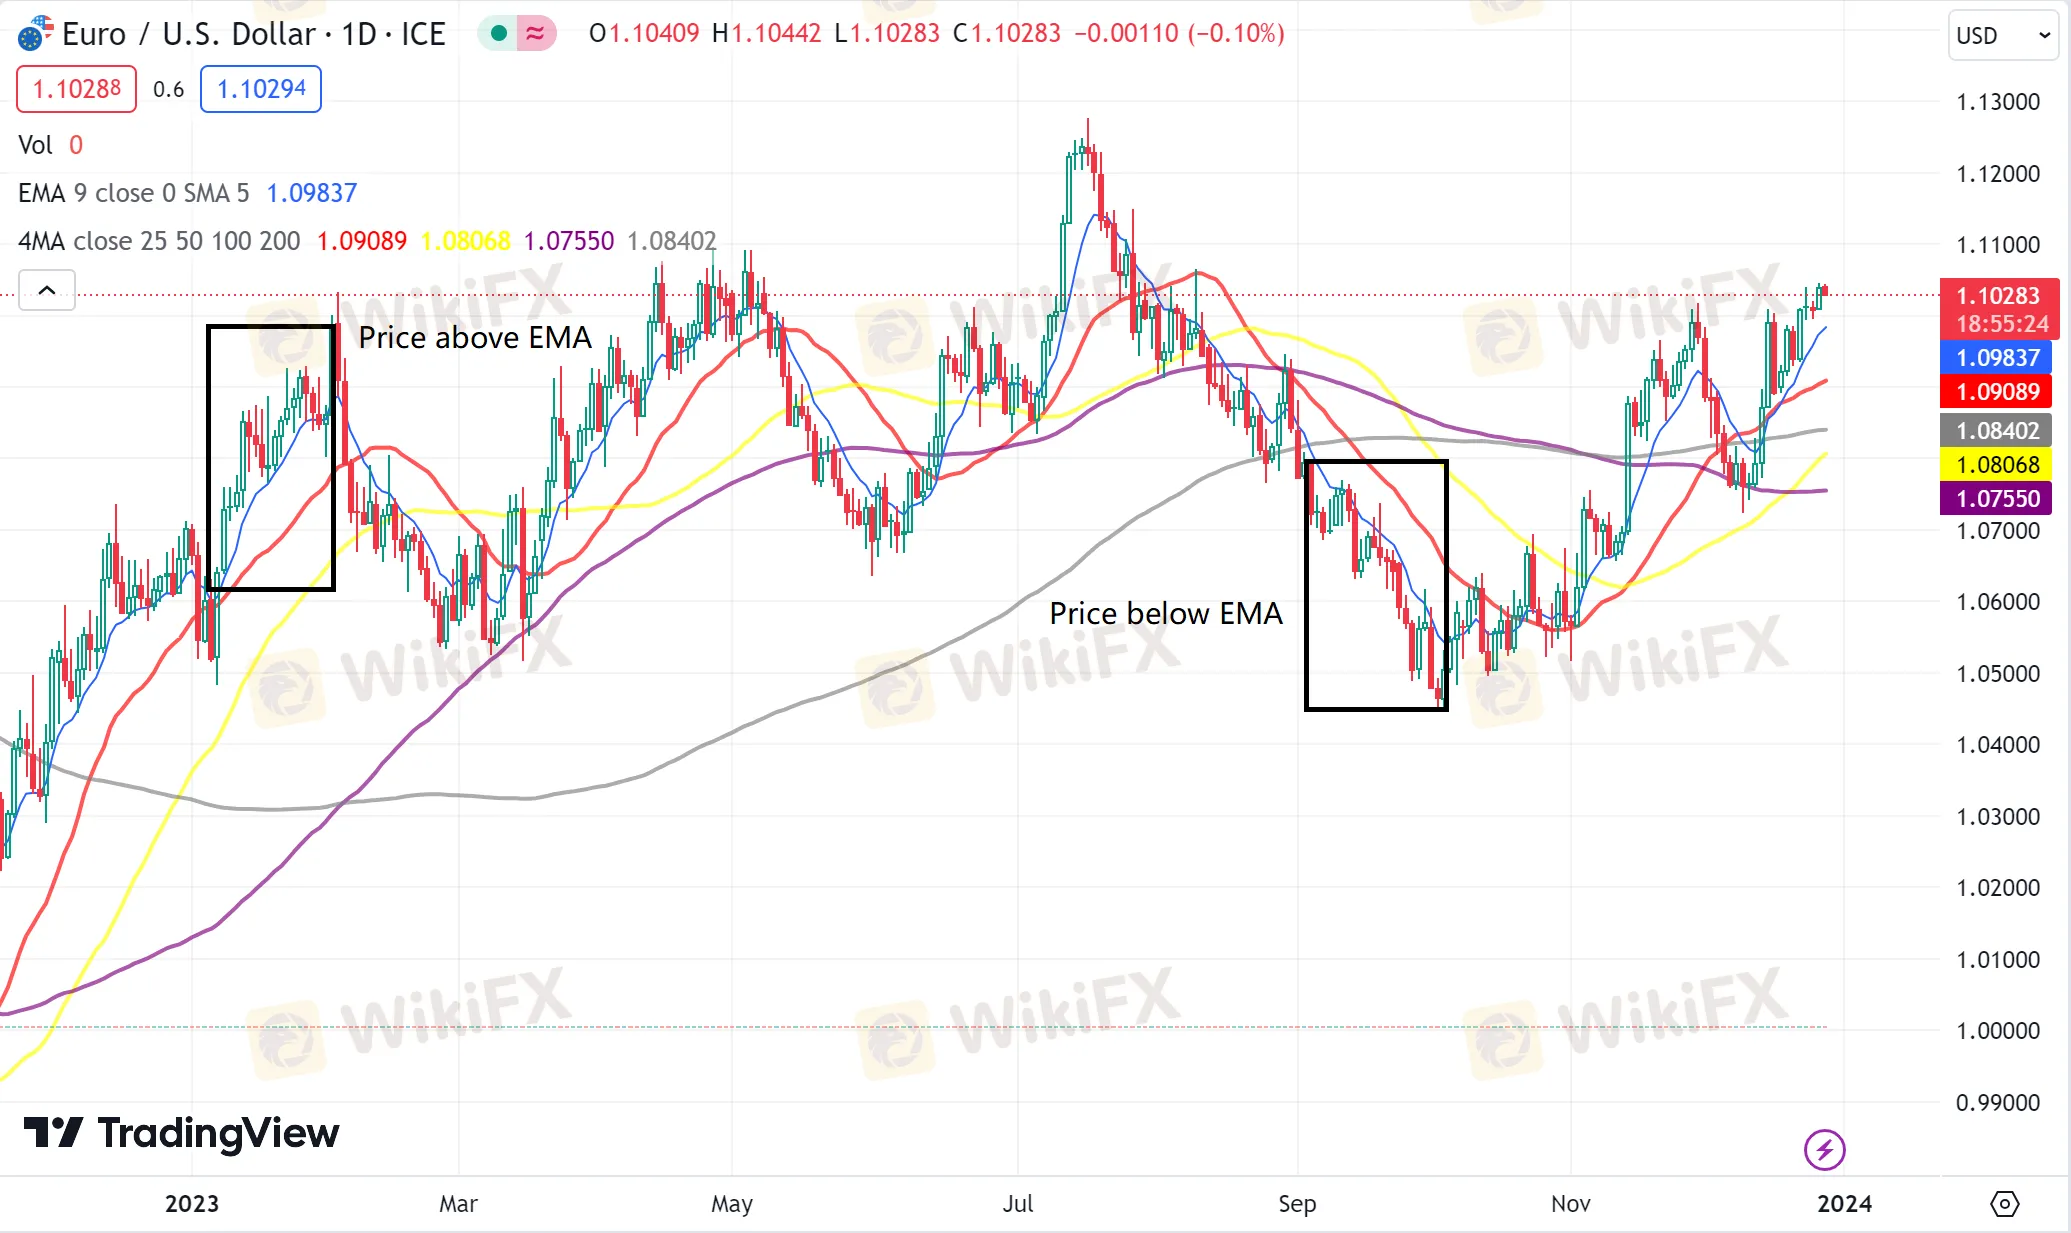
Trend Confirmation: Moving averages are often used to confirm market trends. When prices are above the moving average and remain stable, it suggests an upward trend. Conversely, when prices are below the moving average and remain stable, a downtrend may be present.

Cross Signals: Crossings of moving averages are frequently used as indicators to generate buy or sell signals. When a short-term moving average crosses above a long-term moving average, it may generate a buy signal, indicating a potential uptrend. Conversely, when the short-term line crosses below the long-term line, a sell signal may emerge, suggesting a potential downtrend. For example, plotting the 200-day and 50-day moving averages on a chart can generate buy signals when the 50-day moving average crosses above the 200-day moving average and sell signals when the 50-day line crosses below the 200-day line.

Support/Resistance Identification: Moving averages can be used to identify support and resistance levels. In an uptrend, short-term moving averages may act as support, while in a downtrend, they may act as resistance. Traders can observe whether prices can break through the moving averages to assess market strength, weakness, and potential trend reversals.

Multiple Moving Average Strategies: Some traders use multiple moving averages, such as dual moving average combinations or triple moving average combinations. These combinations can provide more cross signals and trend confirmations. For instance, the crossing of two moving averages might be used to determine entry points, while the trend direction of a longer-term moving average confirms the overall trend.

Moving Average Convergence Divergence (MACD)
Definition
Moving Average Convergence Divergence (MACD) is both a trend indicator and a momentum indicator, revealing the relationship between two moving averages of a security's price. The MACD indicator consists of two lines and a histogram: the fast line (white line) is the DIF, the slow line (yellow line) is the DEA, and the histogram represents MACD:
The two lines, namely the fast line and the slow line. The fast line is typically the result of subtracting the 26-day exponential moving average from the 12-day exponential moving average, while the slow line is the 9-day exponential moving average of the fast line.
The histogram is derived by subtracting the slow line from the fast line. A positive histogram indicates that the fast line is above the slow line, while a negative histogram indicates that the fast line is below the slow line.
The signal line is the 9-day exponential moving average of the histogram. It helps smooth the histogram, providing clearer crossover signals.
Usage
Trend Confirmation:
When the MACD line is above the zero line, it indicates that the fast line is above the slow line, signaling a potential uptrend.
When the MACD line is below the zero line, it indicates that the fast line is below the slow line, signaling a potential downtrend.

Signal Line Crossovers:
When the MACD line crosses above the signal line, creating a bullish crossover, it may be a buy signal.
When the MACD line crosses below the signal line, creating a bearish crossover, it may be a sell signal.

Histogram:
Observe changes in the histogram. A histogram above the zero line indicates an uptrend, while below indicates a downtrend.
Changes in peaks and troughs can reflect market momentum.
Divergence Signals:
Relative Strength Index (RSI)
Definition
The Relative Strength Index (RSI) is a momentum indicator used to measure the overbought or oversold conditions of an asset's price and the strength of market trends. The calculation of RSI is based on the price movements over a specified time period, commonly set at 14 trading days. Here are the general steps for calculating RSI, providing a better understanding of its meaning and usage.
Calculate Daily Price Changes:
Calculate the price change for each trading day, which is the difference between the closing price of the current day and the closing price of the previous day.
Calculate Average Gains and Losses:
Sum all positive price changes (gains) and negative price changes (losses) separately, then divide each sum by the chosen calculation period, usually 14 trading days.
Calculate Relative Strength Index (RSI):
Use the following formula to calculate the Relative Strength Index (RSI):


This formula limits the RSI values between 0 and 100.
Usage:
On-Balance Volume (OBV)
Definition
On-Balance Volume (OBV) is an accumulation-distribution indicator that classifies daily trading volume into buying and selling categories. It then accumulates the volumes of buying and selling separately, resulting in a cumulative OBV curve. OBV helps traders assess the buying and selling pressure in the market, assisting them in making more informed trading decisions. Here are the general steps for calculating OBV, providing a better understanding of its meaning and usage:
If the closing price of the day is higher than the previous day, add the day's trading volume to the OBV.
If the closing price of the day is lower than the previous day, add the negative value of the day's trading volume to the OBV.
If the closing price of the day is equal to the previous day, the OBV remains unchanged.
This way, the cumulative curve of OBV can display the relative strength of buying and selling pressure over a specific period, providing reference for analyzing market trends.
Usage
Bottom Line
Overall, trend trading strategies are common and effective methods in the forex market, and the use of four common indicators (Moving Average, Moving Average Convergence Divergence (MACD), Relative Strength Index (RSI), and On-Balance Volume (OBV)) provides rich market information and trading signals.
When formulating trend trading strategies, traders need to carefully consider the advantages and disadvantages of each indicator and flexibly apply them to adapt to different market conditions. It is important to understand that a single indicator may not be sufficient to make comprehensive decisions, so it is best to use a combination of multiple indicators to improve the accuracy of trading decisions.
Furthermore, successful trend trading relies not only on technical analysis tools but also on prudent risk management and disciplined execution. Regularly reviewing and adjusting trading strategies, staying synchronized with the market, will help improve a trader's performance in trending markets.
Lastly, traders should keep in mind that market risks always exist, and there is no absolute guarantee of success. Therefore, it is recommended that traders maintain caution, continually learn, and enhance their trading skills. By continually improving their analytical abilities and market insights, traders can better cope with the challenges of the forex market and achieve more reliable trading results.


