
Globale Broker-Regulierungsanfrage-App
WikiFX
Deutsch
简体中文
繁體中文
English
Pусский
日本語
ภาษาไทย
Tiếng Việt
Bahasa Indonesia
Español
हिन्दी
Filippiiniläinen
Français
Deutsch
Português
Türkçe
한국어
العربية
Liquidity-Driven Rally Underway: The Final Surge Has Yet to Arrive
Zusammenfassung:Following last Fridays Bank of Japan policy meeting, uncertainty in the market was largely cleared, pushing USD/JPY to extend its climb beyond the 157 level. The continued depreciation of the yen sign
Following last Fridays Bank of Japan policy meeting, uncertainty in the market was largely cleared, pushing USD/JPY to extend its climb beyond the 157 level. The continued depreciation of the yen signals that the liquidity-driven market rally has not come to an abrupt end. On the contrary, once the policy event concluded, capital markets entered a “relief celebration” phase, driving a synchronized rise across Bitcoin, equities, and gold.
As the yen weakened sharply, Japan‘s Finance Minister Shunichi Suzuki expressed concern over the currency’s rapid depreciation, noting that recent hours have seen one-sided and excessive volatility. He reiterated that, under the U.S.–Japan joint statement signed in September, currency intervention is limited to addressing disorderly and excessive market moves.
The yens price action highlights a market environment increasingly biased toward speculative positioning. From our perspective, this dynamic is bullish in the short term but bearish over the longer horizon. In the near term, liquidity continues to flow aggressively into a broad range of assets. Importantly, the CNN Fear & Greed Index remains within neutral territory, suggesting speculative sentiment has not yet reached overheating levels. This implies that the probability of an imminent downside inflection remains relatively low, allowing investors to maintain a constructive stance toward risk assets in the short run.
")
(Figure 1: CNN Fear & Greed Index | Source: CNN)
Meanwhile, the University of Michigan released its latest consumer sentiment report last Friday, showing a decline in inflation expectations. However, because absolute price levels remain elevated, consumer frustration has not meaningfully eased. While expectations for future inflation have softened, persistently high prices continue to exert significant pressure on household finances.
Consumer confidence should not be viewed as a leading indicator, but rather as a lagging one. Consumer sentiment tends to reflect economic realities that have already occurred, rather than providing reliable forecasts of future conditions.
The only forward-looking insight that can be reasonably inferred from consumer sentiment data is a potential reduction in consumer spending.
We believe that the more consumers cut back today, the more disposable income they may accumulate for the future. Expectations for a late-stage market surge or a euphoric investment phase are likely to coincide with a period of broadly optimistic consumer sentiment. Interpreting this report through such a lens offers a more balanced perspective and helps investors remain alert to the risk of a post-euphoria economic slowdown.
")
(Figure 2: Inflation Expectations | Source: University of Michigan)Gold Technical Analysis
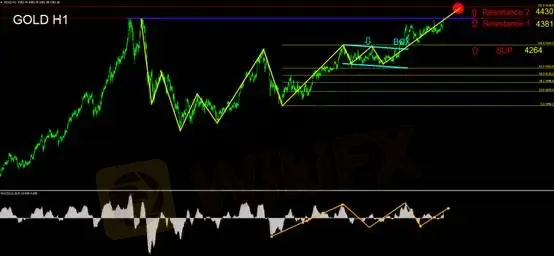
Gold has continued to benefit from the persistent depreciation of the Japanese yen, driving prices steadily higher. The metal has now broken out of its previous consolidation range and surpassed prior highs, challenging resistance near the 4,381 level.
From a technical perspective, the MACD oscillator shows that prices have broken above previous highs and resolved earlier bearish divergence. As gold prices advanced, the MACD reversed from below the zero line and returned to positive territory. Technically, bearish positioning as of last Friday should have transitioned to a bullish bias, with a higher probability of continued intraday upside.
Applying Fibonacci extension analysis, the 1.618 extension projects an upside target around 4,430.
At current levels, trading strategy should remain flexible. Intraday guidance suggests monitoring the 4,381 level as key support. As long as prices hold above this zone, light long positions are favored.
On the hourly chart, attention should be paid to the 4,360 level, which serves as a critical bull–bear threshold. A decisive break below 4,360 would significantly increase the probability of a false breakout.
Support Levels
SUP1: 4,264
Resistance Levels
Resistance 1: 4,381
Resistance 2: 4,430
Risk DisclosureThe views, analyses, research, price levels, and other information provided above are for general market commentary only and do not represent the position of this platform. All readers assume full responsibility for any risks incurred. Please trade with caution.
Haftungsausschluss:
Die Ansichten in diesem Artikel stellen nur die persönlichen Ansichten des Autors dar und stellen keine Anlageberatung der Plattform dar. Diese Plattform übernimmt keine Garantie für die Richtigkeit, Vollständigkeit und Aktualität der Artikelinformationen und haftet auch nicht für Verluste, die durch die Nutzung oder das Vertrauen der Artikelinformationen verursacht werden.
WikiFX-Broker
Aktuelle Nachrichten
JP Morgan will Präsenz in digitalen Assets ausbauen, prüft den Kryptohandel für institutionelle Kunden
 WikiFX
Shiba Inu unter Verkaufsdruck: Kurs droht Abrutschen auf Jahrestiefs
WikiFXXLM unter Druck: Schwache Derivatedaten deuten auf Kursrutsch unter 0,20 Dollar hin
WikiFXRallye bei den Metallen: Warum Gold, Silber und Kupfer 2025 neue Rekordhöhen erreicht haben
WikiFX30 Milliarden vom Staat – kann der Deutschlandfonds private Investoren wirklich locken?
WikiFXXRP unter Druck: Trotz ETF-Zuflüssen rutscht Ripple weiter ab
WikiFXWechselkursberechnung
USD

CNY
Aktueller Wechselkurs: 0
Bitte geben Sie den Betrag ein
USD
Konvertierbarer Betrag
CNY
Berechnen