简体中文
繁體中文
English
Pусский
日本語
ภาษาไทย
Tiếng Việt
Bahasa Indonesia
Español
हिन्दी
Filippiiniläinen
Français
Deutsch
Português
Türkçe
한국어
العربية
TradingView Enhances Screener Functionality for Traders
Abstract:TradingView revolutionizes trading analysis with its latest screener update. Experience advanced chart analysis, customizable views, and precise timeframes. Empower your financial decisions with cutting-edge tools for refined market analysis. Stay ahead in dynamic financial markets.
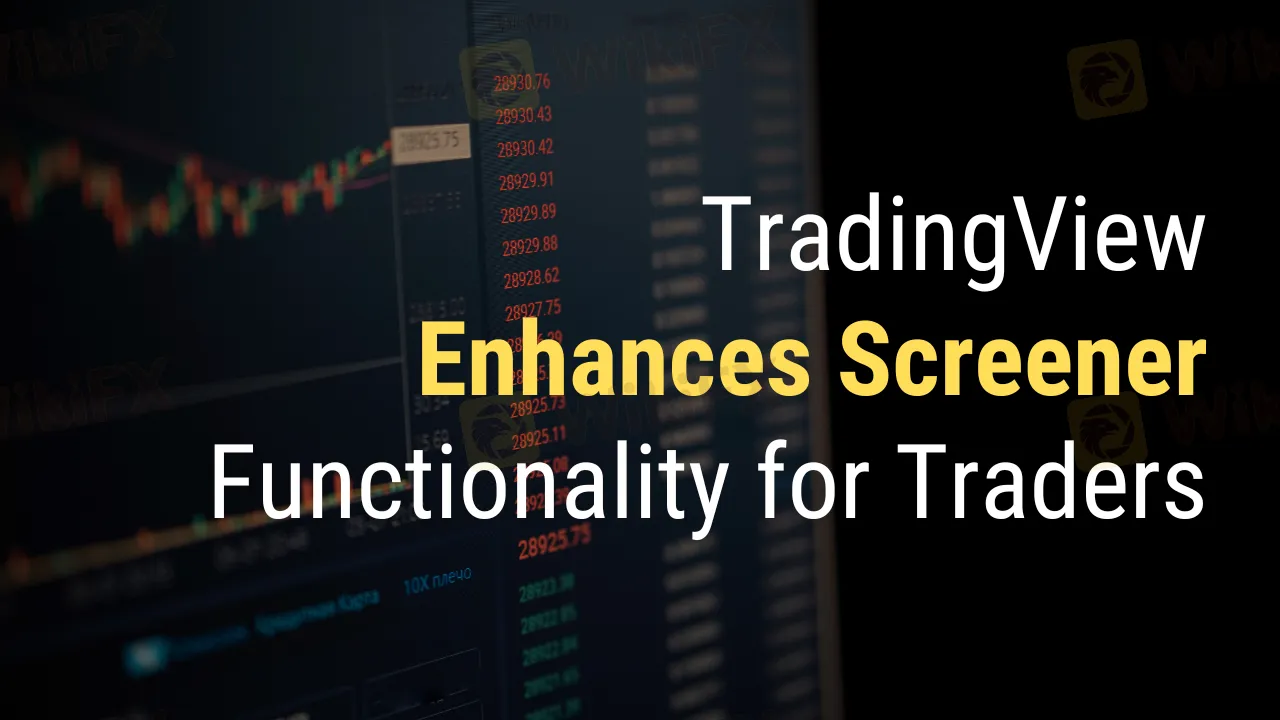
TradingView, a leading platform for financial analysis and trading, has recently unveiled an update to its screeners, introducing powerful features that offer traders expanded capabilities for in-depth data analysis on symbol charts.
The newly introduced functionality provides traders with two distinctive ways to view and interpret data within stock, ETF, and crypto coin screeners:
Table View: This organized presentation displays data in a tabular format with customizable column sets, allowing users to perform efficient parameter analysis and comparison.
Chart View: Traders can now visualize data through charts, showcasing price changes over selected intervals and presenting trading volume dynamics. This graphical representation provides a more intuitive understanding of market trends and potential trading opportunities.

By choosing the relevant option in the upper left corner of the screener interface, users may easily transition between the Table view and Chart view. The interface default is the Area chart type, and users possess the adaptability to opt for other chart types, including Candles and Lines.

In addition to these viewing options, each data range is now associated with specific timeframes, offering traders a more granular level of control over their analyses. The available timeframes include:
1day: 5-minute timeframe
5days: 15-minute timeframe
1month: 1-hour timeframe
3months: 4-hour timeframe
6months: 1-day timeframe
YTD (Year-to-Date): 1-day timeframe
1year: 1-week timeframe
5years: 1-month timeframe
All data: 1-month timeframe
With smaller displays, users can conveniently select the date range from a dropdown menu. For example, choosing one year will result in each bar representing one week, facilitating a more focused analysis.
With Chart View activated, traders gain access to a suite of filters and market selection options, allowing for a more refined and tailored analysis.
These changes aim to speed trade and provide users with vital data to help them make intelligent decisions in the ever-changing financial markets. TradingView's dedication to ongoing development gives traders access to cutting-edge market research and strategy tools.

Disclaimer:
The views in this article only represent the author's personal views, and do not constitute investment advice on this platform. This platform does not guarantee the accuracy, completeness and timeliness of the information in the article, and will not be liable for any loss caused by the use of or reliance on the information in the article.
Read more

Trading Oscillators: The Secret Tool Every Trader Should Know
If you’ve ever looked at a trading chart and wondered how traders know when a price is “too high” or “too low,” the answer often lies in trading oscillators. A trading oscillator is a type of technical indicator that helps traders measure the momentum of price movements. In simple terms, it tells you when a currency pair, stock, or commodity might be overbought or oversold — which can signal a potential reversal.

FINRA announces an $80,000 charge on Supreme Alliance LLC
The Financial Industry Regulatory Authority (FINRA) has announced that Supreme Alliance LLC has agreed to pay a fine of $80,000 as part of a settlement addressing supervisory and compliance failures related to variable annuity transactions and representative investigations.

Voices of the Golden Insight Award Jury - Simon So, Chief Experience Officer of Hantec Financial
The “WikiFX Golden Insight Award” is dedicated to uniting industry forces to jointly build a safe and robust forex ecosystem, driving industry innovation and sustainable development. Now it launches a brand-new interview series — “Voices of the Golden Insight Award Jury”. Through in-depth interviews with authoritative jury members, this series will explore the future landscape of the forex industry and the shared mission of industry elites in enhancing innovation, compliance, and sustainable development.

JP Markets Review: High Spread & Commission, Fake Bonus Lure & Withdrawal Hassles Frustrate Traders
Have you been lured into opening a JP Markets Forex Trading Account with a high bonus offer that never existed? Have you found the spread and commission charges higher on JP Markets Login than what’s advertised on the broker’s website? Wondering why you are not able to withdraw funds from your trading account? Well, all of these hint at a potential forex investment scam. Many traders have expressed their disappointment while sharing the JP Markets Review online. In this article, we have shared certain complaints. Take a look at them.