Abstract:Gold has rallied to its highest level since August 2020 as pandemonium has gripped markets in the fallout from Russias invasion of the Ukraine.
GOLD, XAU/USD, US DOLLAR (DXY), REAL YIELDS, FED, UKRAINE - TALKING POINTS
Gold has raced up as nervy markets see scarcity from Russian sanctions
Real yields have gone lower while haven assets like gold have benefitted
Fed rate riseis priced in for next week. Will a hike help XAU/USD?
Many Western countries are looking at imposing various sanctions against Russia and the commodities that they export are seeing the largest gains. These include oil, gas, nickel, copper and of course gold.
In reality though, gold has not seen the size of gains that these other markets have experienced. This is despite other tail winds supporting the precious metal.
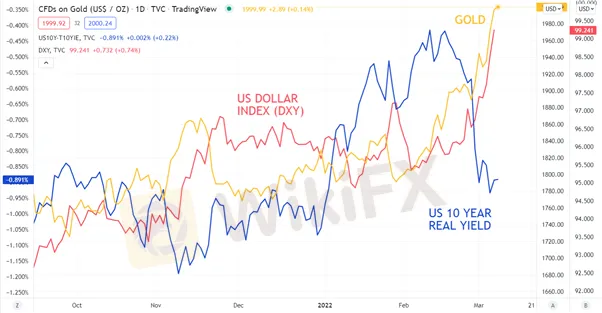
Real yields in the US have been falling in the last few weeks as shown in the chart below. 10-year Treasuries have a notional yield of 1.79% while the market priced 10-year inflation rate expectation is 2.77%, to give a real yield of -0.98%.
Sinking real yields typically boosts gold prices as the alternative of investing in Treasuries becomes less attractive from a real return perspective.
US CPI will be published on Thursday and the market is anticipating an annual headline rate of 7.8% and 6.4% for the year-on-year core rate. Consistently high inflation could have ongoing implications for real yields.
The Federal Reserve is expected to raise rates by 25 basis points (bp) at their Federal Open Market Committee (FOMC) meeting next week.
The US Dollar has also benefitted from the uncertainty in markets and a more hawkish Fed has underpinned it. A strengthening USD normally works against a rising gold price, but that has been overwhelmed by the other factors already mentioned.
If the Fed sticks to its plan, it may not have much impact as it has been very well telegraphed. Any variation from a 25 bp hike could see further volatility.
GOLD, US DOLLAR (DXY) AND US 10-YEAR REAL YIELD

GOLD TECHNICAL ANALYSIS
Todays 18-month peak on gold opens up the possibility of a move to test the all-time high of 2,075.14, seen in August 2020.
Before that, it will need to clear a resistance level at another previous high of 2,015.65.
A bullish triple moving average (TMA) formation requires the price to be above the short term simple moving average (SMA), the latter to be above the medium term SMA and the medium term SMA to be above the long term SMA. All SMAs also need to have a positive gradient.
Not surprisingly, this move has seen all the short, medium and long-term SMAs turn to positive gradients.
Looking at the 10, 55 and 100-day SMAs, this could suggest that bullish momentum may still be in play as all criteria has been met for a TMA.
A move below the 10-day SMA might be worth watching for an indication that momentum could be fading.


