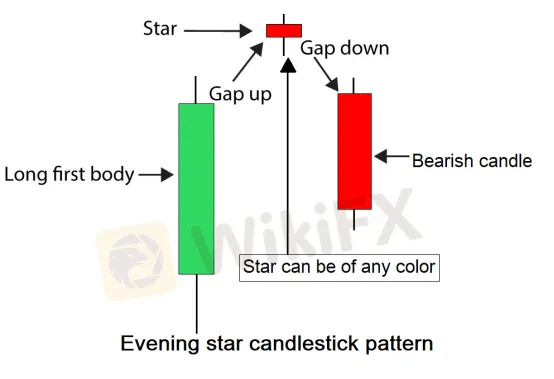
Abstract:The bearish evening star is a three-candlestick pattern with a lengthy and bullish first candle, a gap upward on the second candlestick, and a very narrow range on the third candlestick. This is thought to signify a star in the sky announcing the arrival of darkness, and so bearish. A lower gap and a longer candlestick make up the third candlestick.

What is the Candlestick Pattern of the Evening Star?
The bearish evening star is a three-candlestick pattern with a lengthy and bullish first candle, a gap upward on the second candlestick, and a very narrow range on the third candlestick. This is thought to signify a star in the sky announcing the arrival of darkness, and so bearish. A lower gap and a longer candlestick make up the third candlestick.
How does the evening star candlestick pattern work? When this pattern forms, you'll see a gap higher, followed by a gap lower, and a lot of selling pressure. This indicates that the buyers have been blown out, putting downward pressure on the market. This frequently indicates that a large selloff is imminent. While most people think of this as a candlestick pattern that appears at a swing high, it may appear anywhere on a chart.
Examine the chart of Nike stock below for an example of the evening star candlestick formation. The market had been in an uptrend, gaped higher to create a short candlestick, and then gapped down on the third day to indicate symptoms of fatigue, as shown in the highlighted region. Most traders will sell this set up short if it breaks below the bottom of the lowest of the three candlesticks, with a stop loss placed at the top of the star (the middle candlestick). While some purists insist that the “star” must be a doji, the star just has to be smaller than the other two candlesticks to indicate a slowdown of speed.
The most common approach to trade this pattern is to purchase on a break of the higher of the two long candlesticks, with a stop loss below the star's bottom. I've included another example below, this time using Nike stock, because it demonstrates several reasons to believe the pattern would work. You have the pattern itself, as well as the first candlestick, which turned out to be a “inverted hammer,” and breaking over the top of that wick was a good indicator to go long. As you can see, the market blasted off from that moment, gaping higher, pulling back to close the gap, and then turning around to head for $59 again.
These patterns might be highly beneficial depending on the market you're trading. After all, you have to remember that something has to cause the market gap to rise, then fall, or vice versa. To put it another way, as soon as one side of the market gained ground, the other side fought back and took it away. That is a really strong signal since it demonstrates a rapid shift in attitude over the period of a few days. While this is a relatively uncommon pattern in the currency markets, it does tend to perform well in the stock commodities markets, which are often less liquid than Forex.


