


You Must Know How These Psychological Traps Destroy Financial Judgment
Every aspiring forex trader begins with a powerful vision of financial freedom. Yet despite this promise, most traders struggle to achieve consistent success.
Original
简体中文
繁體中文
English
Pусский
日本語
ภาษาไทย
Tiếng Việt
Bahasa Indonesia
Español
हिन्दी
Filippiiniläinen
Français
Deutsch
Português
Türkçe
한국어
العربية
اردو


Abstract:NEW ZEALAND DOLLAR, NZD/USD, NZD/JPY, NZD/CAD, NZD/CHF - TECHNICAL FORECAST
New Zealand Dollar has been falling lately. Will losses extend?
NZD/USD eyeing Falling Wedge, NZD/JPY biased gently lower
NZD/CAD drop faces next test, NZD/CHF Death Cross ahead?

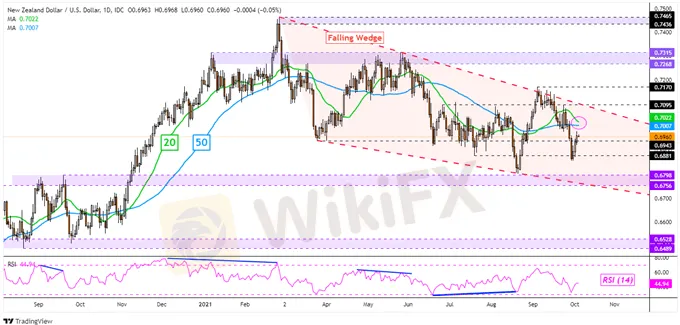
The New Zealand Dollar seems to be in the process of its next leg lower against the US Dollar within the boundaries of a Falling Wedge chart formation. In early September, NZD/USD tested the ceiling of the wedge but was unable to pierce it. That established a new lower swing high at 0.7170. Recently, prices appeared to bounce off the 0.6881 inflection point, but key resistance points may soon come into play.
Keep a close eye on the 20- and 50-day Simple Moving Averages (SMAs), where a bearish Death Cross may soon form. That would underpin the downside bias. While the Falling Wedge is itself bullish, prices may continue to consolidate with a downward slope within the formation. Falling under the September low may open the door to revisiting the 0.6798 – 0.6756 area. There, NZD/USD may bounce off the floor of the wedge.
The New Zealand Dollar has broadly consolidated against the Japanese Yen since late February, though price action since May has been tilted cautiously lower. A falling trendline appears to be guiding the pair to the downside. Recently, prices have been ranging between that barrier and the 76.666 – 76.225 inflection zone. It seems that for the time being, the 200-day SMA is aiding the dominant upside bias.
Falling under the inflection zone could open the door to retesting the August low at 74.567. Such an outcome would entail passing through the 75.640 inflection point. On the flip side, clearing the trendline may open the door to testing the August high at 78.661. Confirming a breakout above this price could then entail a rise towards the current 2021 high at 80.182.

The New Zealand Dollar could be vulnerable to losses against the Canadian Dollar in the near-term. After NZD/CAD turned sharply lower following a test of the 0.9022 – 0.9082 resistance zone and potential falling trendline from February, a bearish Death Cross formed by the 20- and 50-day SMAs could emerge. That would underscore an immediate technical bias to the downside.
Still, the pair has broadly consolidated since the summer of 2020. The 0.8631 – 0.8577 support zone has been holding over this period. Prices are currently testing the 38.2% Fibonacci extension at 0.8763 on the chart below. Taking that out may open the door to retesting the support zone. Otherwise, a turn back above the near-term SMAs could open the door a test of the falling trendline from earlier this year.

The New Zealand Dollar is also weakening against the Swiss Franc as of late. NZD/USD seems to have been recently rejected at a falling resistance zone from February, pivoting lower towards the 0.6229 – 0.6267 support area. Keep a close eye on the 20- and 50-day SMAs, where a bearish Death Cross could emerge in the coming days. That may precede further losses, placing the focus on the 38.2% Fibonacci extension at 0.6379 and the 50% level at 0.6317.
Breaking under the support zone further exposes the 78.6% Fibonacci extension at 0.6165. On the other side, a near-term rise places the focus on the 0.6582 – 0.6559 resistance zone. Clearing that would expose the April high, which is just under 0.6645. Confirming a breakout above this point may then pave the way for a retest of the current 2021 high at 0.6767.

Source: DailyFX
Disclaimer:
The views in this article only represent the author's personal views, and do not constitute investment advice on this platform. This platform does not guarantee the accuracy, completeness and timeliness of the information in the article, and will not be liable for any loss caused by the use of or reliance on the information in the article.

Every aspiring forex trader begins with a powerful vision of financial freedom. Yet despite this promise, most traders struggle to achieve consistent success.

In the foreign exchange and online trading industries, regulation is often referred to as a technical requirement. Yet for traders of all levels, a broker’s regulatory status is one of the most fundamental markers of safety and transparency. When a broker loses its licence, it is never a minor administrative event. It signals structural problems that can place client funds and trading conditions at significant risk. Understanding why brokers lose their licences, what it means, and how traders can stay informed is essential in today’s rapidly shifting financial landscape.

The Financial Conduct Authority (FCA) in the UK has published the FCA Warning List- October 2025, alerting forex traders and investors about unauthorized brokers. These firms are operating without the necessary FCA approval. To safeguard your funds and avoid scams, be sure to check the full warning list below.

Social media is no longer just a platform to connect with people and express yourself but it has also become a tool for scammers. Social media scammers are using these platforms to deceive people. In this article, we’ll explore the latest social media financial scams you need to be aware of, including AI-driven scams, impersonation scams, crypto scams, influencer fraud, and Instagram forex scams.
WikiFXWikiFXWikiFXWikiFXWikiFXWikiFXWikiFXWikiFXWikiFXWikiFX