Forex is a game that I enjoy playing
These champions have one thing in common: they not only work their butts off, but they also enjoy what they do.
简体中文
繁體中文
English
Pусский
日本語
ภาษาไทย
Tiếng Việt
Bahasa Indonesia
Español
हिन्दी
Filippiiniläinen
Français
Deutsch
Português
Türkçe
한국어
العربية
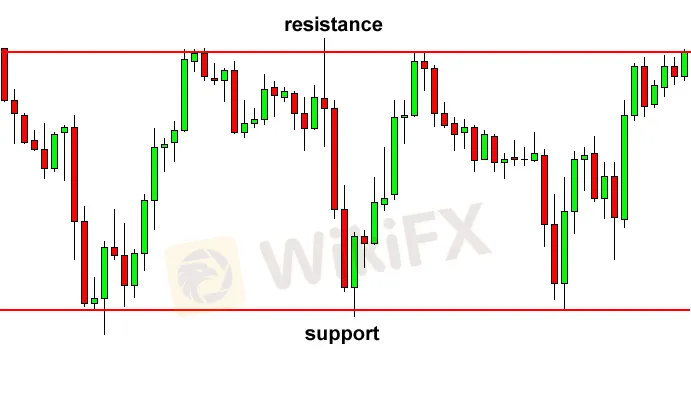
Abstract:When the price is bordered by parallel support and resistance levels, a rectangle is produced on the chart. A rectangle represents a moment of consolidation or hesitation between buyers and sellers as they trade punches but neither has the upper hand.
When the price is bordered by parallel support and resistance levels, a rectangle is produced on the chart.
A rectangle represents a moment of consolidation or hesitation between buyers and sellers as they trade punches but neither has the upper hand.
Before breaking out, the price will “test” the support and resistance levels multiple times.
The price may then move in the direction of the breakout, whether to the upside or to the downside.

The pair was clearly defined by two important price levels that are parallel to one another in the example above.
All we have to do now is wait for one of these levels to break and enjoy the trip!
When you see a rectangle, remember to THINK OUTSIDE THE BOX!
Rectangle with a Bearish Sign
During a decline, when the price consolidates for a while, it forms a bearish rectangle.
This occurs because sellers will likely crave to take a breather before lowering the pair any further.

Price in this case burst through the bottom of the rectangle chart pattern and continued to fall.
We could have made an enormous profit on this trade if we had placed a short order just below the support level.

Here's a suggestion:
When the pair breaks through the support, it usually makes a move that is roughly the size of the rectangular pattern.
The pair drifted beyond the objective in the example above, so there was a possibility to capture extra pips!
Rectangular Bullish
Another rectangle chart pattern, this time a bullish rectangle chart pattern.
The price stalled after an increase to consolidate for a while. Can you predict where the price will go next?

If you answered yes, you are right! Take a look at that fantastic upside breakout there!

After breaking over the top of the rectangular pattern, the price surged all the way up.
We may have profited from the trade if we had placed a long order on top of the resistance level!
When a pair breaks, it usually makes a move that is AT LEAST the size of its prior range, just like in the bearish rectangle pattern example.

Do I seem to be breaking out?
Disclaimer:
The views in this article only represent the author's personal views, and do not constitute investment advice on this platform. This platform does not guarantee the accuracy, completeness and timeliness of the information in the article, and will not be liable for any loss caused by the use of or reliance on the information in the article.

These champions have one thing in common: they not only work their butts off, but they also enjoy what they do.

"Patience is the key to everything," American comic Arnold H. Glasgow once quipped. The chicken is gotten by hatching the egg rather than crushing it."

Ask any Wall Street quant (the highly nerdy math and physics PhDs who build complicated algorithmic trading techniques) why there isn't a "holy grail" indicator, approach, or system that generates revenues on a regular basis.

We've designed the School of WikiFX as simple and enjoyable as possible to help you learn and comprehend the fundamental tools and best practices used by forex traders all over the world, but keep in mind that a tool or strategy is only as good as the person who uses it.
