Forex is a game that I enjoy playing
These champions have one thing in common: they not only work their butts off, but they also enjoy what they do.
简体中文
繁體中文
English
Pусский
日本語
ภาษาไทย
Tiếng Việt
Bahasa Indonesia
Español
हिन्दी
Filippiiniläinen
Français
Deutsch
Português
Türkçe
한국어
العربية
Abstract:Taking gains on a long trade at a Fibonacci Price Extension Level is a good strategy in an uptrend. Three mouse clicks are used to determine the Fibonacci extension levels.
The next application of Fibonacci will be to locate “take profit” objectives.
Always remember “Zombieland Rules of Survival #22”:
Know your way out when in doubt!
Let's take a look at an example of an upward trend.
Taking gains on a long trade at a Fibonacci Price Extension Level is a good strategy in an uptrend.
Three mouse clicks are used to determine the Fibonacci extension levels.
Select a notable Swing Low first, then drag your pointer to the most recent Swing High. Finally, retrace your steps by dragging your cursor down and clicking on any of the retracement levels.
This will show both the ratio and the matching price levels for each of the Price Extension Levels. Isn't it cool?
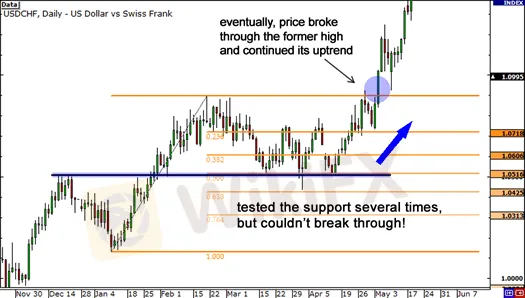
Returning to the USD/CHF chart from the last lesson, let's look at it again.

The 50.0 percent Fib level held strong as support, and the pair ultimately began its advance after three tests. The price has even risen above the previous Swing High in the chart above.
Let's have a look at the Fibonacci extension tool to see where we could have made some money.

Here's a rundown of what transpired after the Swing Low retracement:
Price soared all the way to 61.8 percent, which was almost identical to the previous Swing High.
It dropped back to 38.2 percent, where it found support.
After that, the price rallied and ran into resistance at the 100 percent mark.
The price climbed again a few days later before hitting resistance at the 161.8 percent mark.
The 61.8 percent, 100 percent, and 161.8 percent levels, as shown in the example, would have all been appropriate opportunities to take profits.
Let's look at an example of Fibonacci extension levels being used in a decline.
The overall approach in a decline is to take profits on a short trade at a Fibonacci extension level, as the market frequently finds support at these levels.
Let's look at that downtrend on the 1-hour EUR/USD chart from the Fib Sticks lesson once again.

A doji formed right below the 61.8 percent Fib level in this case. Price then reversed as sellers re-entered the market, bringing it all the way back to the Swing Low.
Let's use the Fib Extension tool to determine where some nice profit targets would have been if we had shorted at the 61.8 percent retracement level.

After the price reversed from the Fibonacci retracement level, here's what happened:
The 38.2 percent level provided support for the price.
The first support level of 50.0 percent held, and it subsequently became a focus of attention.
Before price went down to test the previous Swing Low, the 61.8 percent mark became an area of concern.
If you look ahead, you'll notice that the 100% extension level served as support as well.
At the 38.2 percent, 50.0 percent, and 61.8 percent levels, we might have grabbed profits. All of these levels acted as support, probably because other traders were looking for profit-taking opportunities at these levels as well.
The examples show that price finds at least some temporary support or resistance at the Fibonacci extension levels - not always, but frequently enough to allow you to accurately modify your position to take profits and limit risk.
Of course, there are some issues to address in this situation.
To begin with, it's impossible to predict which Fibonacci extension level will create resistance.
Any of these levels could provide support or opposition.
Another issue is deciding which Swing Low to begin with when constructing Fibonacci extension levels.
One method is to start from the most recent Swing Low, like we did in the examples, and another is to start from the most recent Swing Low of the last 30 bars.
Again, there is no one proper way to do it, but with a lot of experience, you'll be able to make better Swing point judgments.
When using the Fibonacci extension tool, you must exercise caution. You'll have to decide how long the current trend will last. Later, we'll show you how to use methods to determine the strength of a trend.
Let's move on to stop loss placement for now!
Disclaimer:
The views in this article only represent the author's personal views, and do not constitute investment advice on this platform. This platform does not guarantee the accuracy, completeness and timeliness of the information in the article, and will not be liable for any loss caused by the use of or reliance on the information in the article.

These champions have one thing in common: they not only work their butts off, but they also enjoy what they do.

"Patience is the key to everything," American comic Arnold H. Glasgow once quipped. The chicken is gotten by hatching the egg rather than crushing it."

Ask any Wall Street quant (the highly nerdy math and physics PhDs who build complicated algorithmic trading techniques) why there isn't a "holy grail" indicator, approach, or system that generates revenues on a regular basis.

We've designed the School of WikiFX as simple and enjoyable as possible to help you learn and comprehend the fundamental tools and best practices used by forex traders all over the world, but keep in mind that a tool or strategy is only as good as the person who uses it.
