Forex is a game that I enjoy playing
These champions have one thing in common: they not only work their butts off, but they also enjoy what they do.
简体中文
繁體中文
English
Pусский
日本語
ภาษาไทย
Tiếng Việt
Bahasa Indonesia
Español
हिन्दी
Filippiiniläinen
Français
Deutsch
Português
Türkçe
한국어
العربية
Abstract:Fibonacci retracement levels are horizontal lines that show potential price reversal levels. The Fibonacci technique works best when the market is trending, which is the first thing you should know about it.
Let's talk about Fibonacci levels of retracement.
Fibonacci retracement levels are horizontal lines that show potential price reversal levels.
The Fibonacci technique works best when the market is trending, which is the first thing you should know about it.
When the market is heading up, the aim is to go long (or purchase) on a pullback near a Fibonacci support level.
When the market is going DOWN, go short (or sell) on a pullback at a Fibonacci resistance level.
Because they attempt to foretell where price will be in the future, Fibonacci retracement levels are considered a predictive technical indicator.
According to the theory, after price starts a new trend direction, it will retrace or return partway to a previous price level before continuing in the trend direction.
Levels of Fibonacci Retracement
You must first locate recent key Swing Highs and Swing Lows in order to locate these Fibonacci retracement levels.
Click on the Swing High and drag the mouse to the most recent Swing Low for downtrends.
When it comes to uptrends, the opposite is true. Drag the pointer to the most recent Swing High by clicking on the Swing Low.
Is that clear?
Let's look at some examples of how Fibonacci retracement levels might be used in the currency markets.
Uptrend
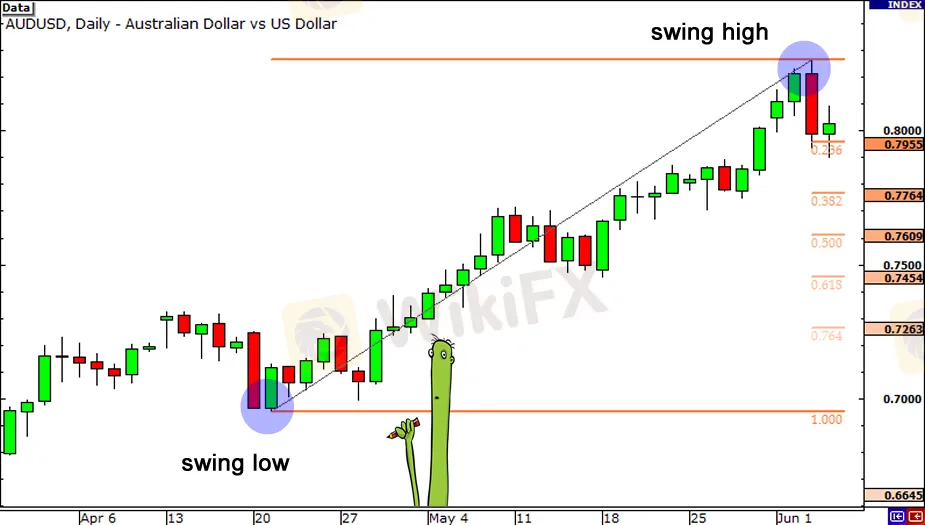
This is a AUD/USD daily chart.

By dragging the cursor from the Swing Low at.6955 on April 20 to the Swing High at.8264 on June 3, we were able to plot the Fibonacci retracement levels.
The retracement levels are calculated and shown automatically by the charting program.
The Fibonacci retracement levels were.7955 (23.6 percent),.7764 (38.2 percent),.7609 (50.0 percent *),.7454 (61.8 percent), and.7263, as shown in the chart (76.4 percent ).
The anticipation now is that if the AUD/USD retraces from its recent high, it will find support at one of the Fibonacci retracement levels since traders will be placing buy orders at these levels as the price drops.
Although the 50.0 percent ratio is not a Fibonacci number, it managed to slip into the group and has never left.
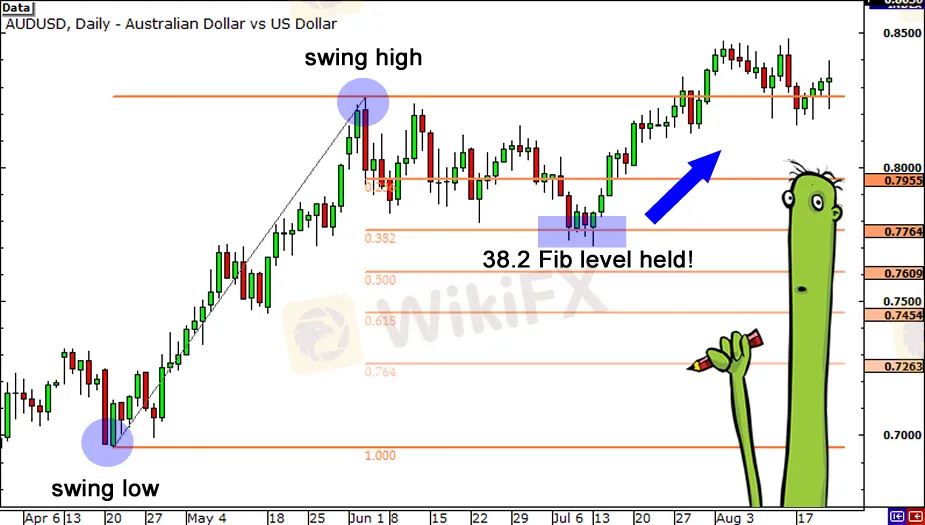
Let's take a look at what transpired after the Swing High.

Price quickly retreated from the 23.6 percent level and continued to fall over the next few weeks.
It even went as low as 38.2 percent, but couldn't close below it.
Around July 14, the market began to rise again, eventually breaking through the swing high.
Buying at the Fibonacci level of 38.2 percent would have clearly been a lucrative long-term trade!
Downtrend
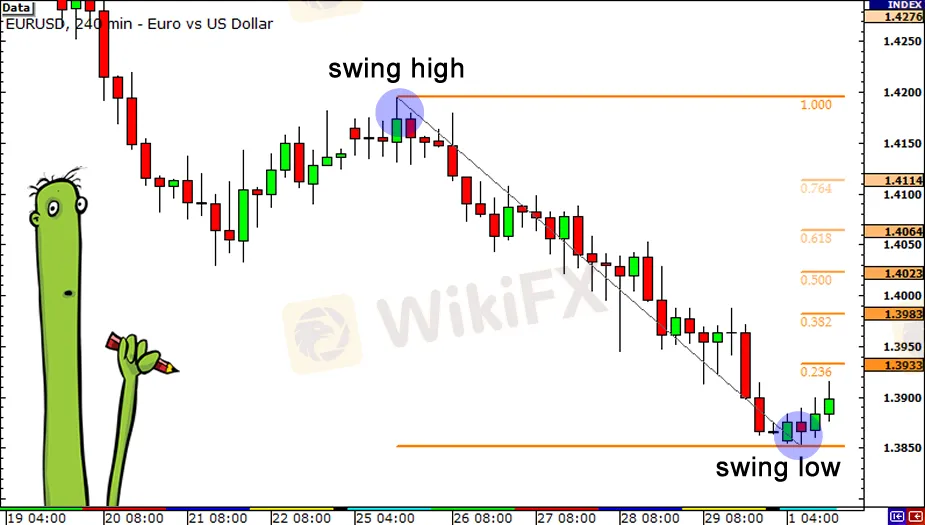
Let's look at how the Fibonacci retracement tool could be used in a decline. A EUR/USD 4-hour chart is shown below.

As you can see, our Swing High was at 1.4195 on January 25 and our Swing Low was at 1.3854 on February 1.
1.3933 (23.6 percent), 1.3983 (38.2 percent), 1.4023 (50.0 percent), 1.4064 (61.8 percent), and 1.4114 are the retracement levels (76.4 percent ).
If the price retraces from this low, traders who wish to play the downtrend at better prices may be ready with sell orders at one of the Fibonacci levels, so if the price retraces from this low, it might perhaps find resistance at one of the Fibonacci levels.
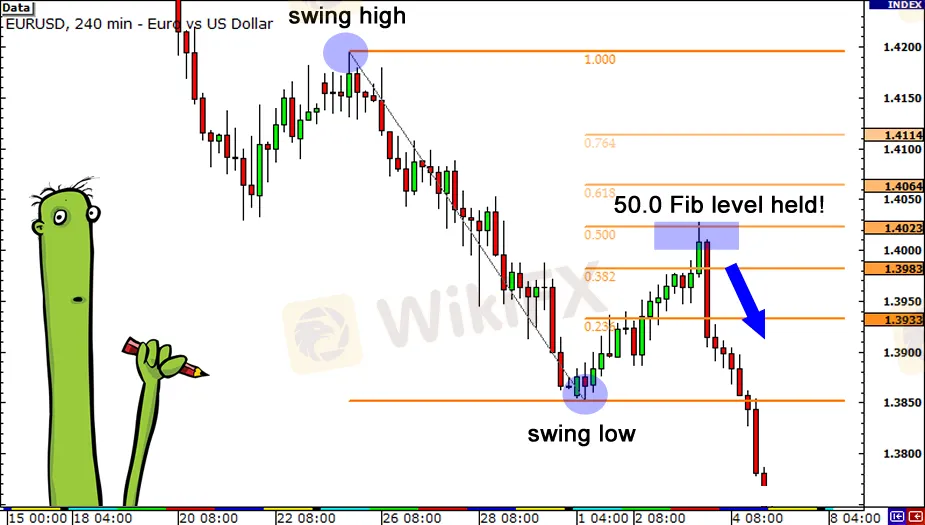
Let's take a look at what went on after that.

Isn't it a sight to behold?!
The market did try to rise, but it paused for a while below the 38.2 percent level before testing the 50.0 percent barrier.
You could have gained a lot more money on that transaction if you had placed orders at 38.2 percent or 50.0 percent.
Price found some transient FX support or resistance near Fibonacci retracement levels in these two examples.
Because so many individuals utilize the Fibonacci technique, those levels of support and resistance become self-fulfilling.
If a large number of market players anticipate a retracement will occur near a Fibonacci retracement level and are ready to open a position when the price hits that level, the market price may be influenced by all of those pending orders.
One thing to keep in mind is that pricing does not always bounce back from these levels. They should be treated as regions of interest, or “KILL ZONES!” as Cyclopip likes to call them. Later on, we'll go through that in further detail.
For the time being, one thing to keep in mind when utilizing the Fibonacci tool is that it is not always simple to use!
If things were so simple, traders would place their orders at Fibonacci retracement levels all the time, and the markets would continue to trend indefinitely.
We'll show you what happens when Fibonacci retracement levels fail in the upcoming lesson.
Disclaimer:
The views in this article only represent the author's personal views, and do not constitute investment advice on this platform. This platform does not guarantee the accuracy, completeness and timeliness of the information in the article, and will not be liable for any loss caused by the use of or reliance on the information in the article.

These champions have one thing in common: they not only work their butts off, but they also enjoy what they do.

"Patience is the key to everything," American comic Arnold H. Glasgow once quipped. The chicken is gotten by hatching the egg rather than crushing it."

Ask any Wall Street quant (the highly nerdy math and physics PhDs who build complicated algorithmic trading techniques) why there isn't a "holy grail" indicator, approach, or system that generates revenues on a regular basis.

We've designed the School of WikiFX as simple and enjoyable as possible to help you learn and comprehend the fundamental tools and best practices used by forex traders all over the world, but keep in mind that a tool or strategy is only as good as the person who uses it.
