
Globale Broker-Regulierungsanfrage-App
WikiFX
Deutsch
简体中文
繁體中文
English
Pусский
日本語
ภาษาไทย
Tiếng Việt
Bahasa Indonesia
Español
हिन्दी
Filippiiniläinen
Français
Deutsch
Português
Türkçe
한국어
العربية
U.S. Fundamentals Remain Red-Hot, With Further Upside Expected Next Year
Zusammenfassung:On the 23rd, the U.S. Bureau of Economic Analysis released its third-quarter GDP report, showing a robust annualized growth rate of 4.3%, while the final reading for Q2 stood at 3.8%. Economic perform
On the 23rd, the U.S. Bureau of Economic Analysis released its third-quarter GDP report, showing a robust annualized growth rate of 4.3%, while the final reading for Q2 stood at 3.8%. Economic performance in both Q2 and Q3 exceeded market expectations, providing continued support for U.S. equities to repeatedly set new all-time highs.
")
(Figure 1. Q3 GDP and Revised Q2 GDP; Source: BEA)
Given the higher volatility of annualized quarter-on-quarter figures, we shift our focus to a year-over-year perspective. GDP growth came in at 2.1% YoY in Q2 and 2.3% YoY in Q3. As illustrated by the red line in the chart below, despite the high base effect in 2024, U.S. GDP growth remains firmly above 2%. Notably, growth appears to have bottomed out and turned higher in Q1, reinforcing a more constructive outlook for risk assets.
")
(Figure 2. U.S. GDP Year-over-Year Growth; Source: MacroMicro)
A closer look at GDP component contributions shows the following breakdown:
Consumption: +2.39
Residential investment: -0.21
Non-residential investment: +0.40
Inventory changes: -0.22
Government spending: +0.39
Exports: +0.92
Imports: +0.67
")
(Figure 3. Contributions of GDP Components; Source: MacroMicro)
The primary drivers of GDP growth this quarter were consumption and net exports. Consumer spending remains resilient, suggesting that the drag from tariff-related pressures has eased and household demand has stabilized. Trade flows continue to benefit from tariff dynamics, leading to a further narrowing of the trade balance. In theory, a shrinking trade deficit should support a stronger U.S. dollar; however, the Dollar Index moved lower instead.
The inverse relationship between a narrowing trade deficit and a weaker Dollar Index is not difficult to rationalize. Against the backdrop of rate cuts and quantitative easing expectations, a softer dollar remains within acceptable bounds. Moreover, frequent verbal intervention from Japans Ministry of Finance to support the yen, combined with ongoing domestic monetary easing and relative strength in non-U.S. currencies, has reinforced dollar weakness. In this environment, a weaker dollar supporting higher gold prices remains a logical outcome. Importantly, following the data release, FedWatch Tool futures continue to price in expectations for two rate cuts, unchanged from prior levels.
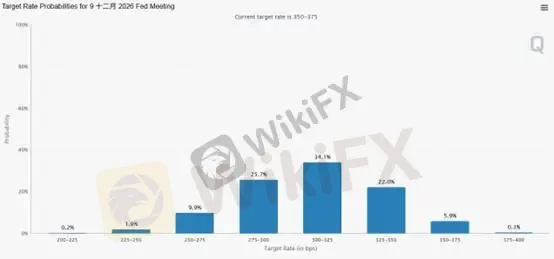
(Figure 4. FedWatch Tool Shows Two Rate Cuts Still Fully Priced In; Source: FedWatch Tool)
On the same day as the GDP release, the U.S. also published October durable goods orders, a key leading indicator for assessing whether the corporate inventory replenishment cycle is nearing its end.
After two consecutive months of growth, new durable goods orders declined 2.2% MoM (approximately USD 6.8 billion), bringing the total to USD 307.4 billion. The pullback was largely driven by the transportation equipment sector, which fell 6.5% MoM to USD 103.9 billion. Volatility within transportation remains the primary drag on headline figures, particularly a sharp 20.1% contraction in non-defense aircraft and parts orders.
Excluding the highly volatile transportation category, core durable goods orders actually rose by 0.2%, signaling underlying stability. Of particular note, non-defense capital goods orders excluding aircraft, a widely watched proxy for corporate investment confidence, continued to trend higher. This suggests that despite ongoing macroeconomic uncertainty, businesses remain committed to equipment upgrades and technological investment.
Unfilled orders climbed further, reaching a record high near USD 1.5 trillion, indicating a solid production pipeline for factories in the months ahead. Overall, Octobers data paints a picture of a manufacturing sector in transition: while temporarily weighed down by specific heavy-industry segments, core manufacturing momentum and shipments (up 0.6%) remain on an upward trajectory.
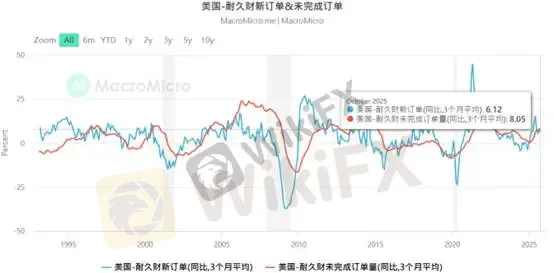
(Figure 5. U.S. Durable Goods New Orders and Unfilled Orders, YoY; Source: MacroMicro)
As December approaches, global financial markets have entered a seasonally quieter phase, with capital markets increasingly characterized by limited upside and asymmetric downside risks. In contrast, precious metals (gold, silver, and copper) continue to exhibit aggressive bullish momentum. This strength is partly underpinned by durable goods data, which supports the fundamental outlook for industrial metals. That said, investors should remain cautious: once market sentiment normalizes, short-term pullback risks cannot be ruled out.
Risk Disclaimer:
The above views, analysis, research, price levels, and related information are provided for general market commentary only and do not represent the position of this platform. All readers assume full responsibility for their own investment decisions and associated risks. Please trade with caution.
Haftungsausschluss:
Die Ansichten in diesem Artikel stellen nur die persönlichen Ansichten des Autors dar und stellen keine Anlageberatung der Plattform dar. Diese Plattform übernimmt keine Garantie für die Richtigkeit, Vollständigkeit und Aktualität der Artikelinformationen und haftet auch nicht für Verluste, die durch die Nutzung oder das Vertrauen der Artikelinformationen verursacht werden.
WikiFX-Broker
Aktuelle Nachrichten
Shiba Inu unter Verkaufsdruck: Kurs droht Abrutschen auf Jahrestiefs
 WikiFX
XLM unter Druck: Schwache Derivatedaten deuten auf Kursrutsch unter 0,20 Dollar hin
WikiFX30 Milliarden vom Staat – kann der Deutschlandfonds private Investoren wirklich locken?
WikiFXXRP unter Druck: Trotz ETF-Zuflüssen rutscht Ripple weiter ab
WikiFXWechselkursberechnung
USD

CNY
Aktueller Wechselkurs: 0
Bitte geben Sie den Betrag ein
USD
Konvertierbarer Betrag
CNY
Berechnen